Written by Dr. Johan Kraft, CTO of Percepio
For more content like this, visit the Percepio website.
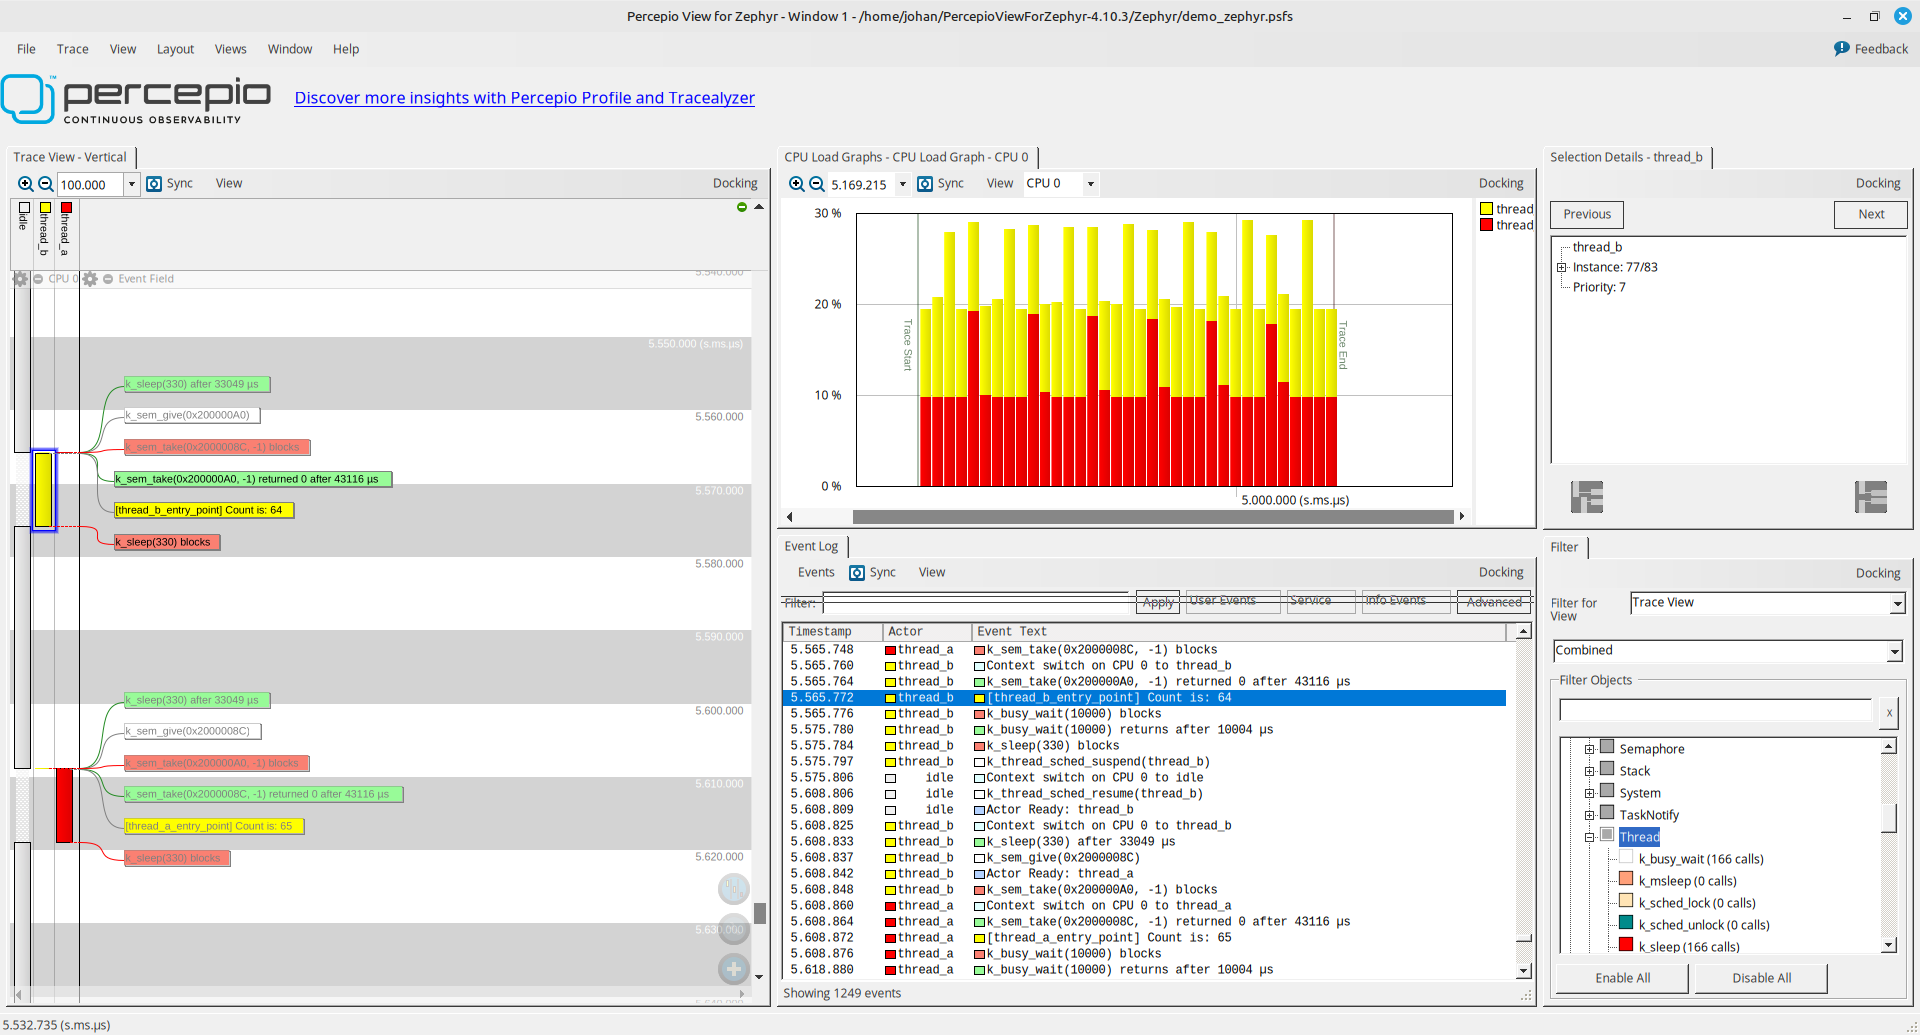
Percepio View is a free -of-charge tracing tool for Zephyr applications, built on Percepio Tracealyzer. It helps developers understand and debug multithreaded behavior in Zephyr, which can be difficult to analyze due to fixed thread priorities and complex interactions.
Percepio Tracealyzer, the commercial foundation of View, offers even more powerful features for visualizing and analyzing system behavior, including continuous streaming and advanced trace views for deeper insights.
Percepio has been an active member of the Zephyr Project for several years, contributing the TraceRecorder library, which is now part of the Zephyr kernel. This collaboration has improved real-time observability for embedded developers using Zephyr RTOS. We’re now providing Percepio View to the Zephyr community as a free tool to help developers build better real-time applications.
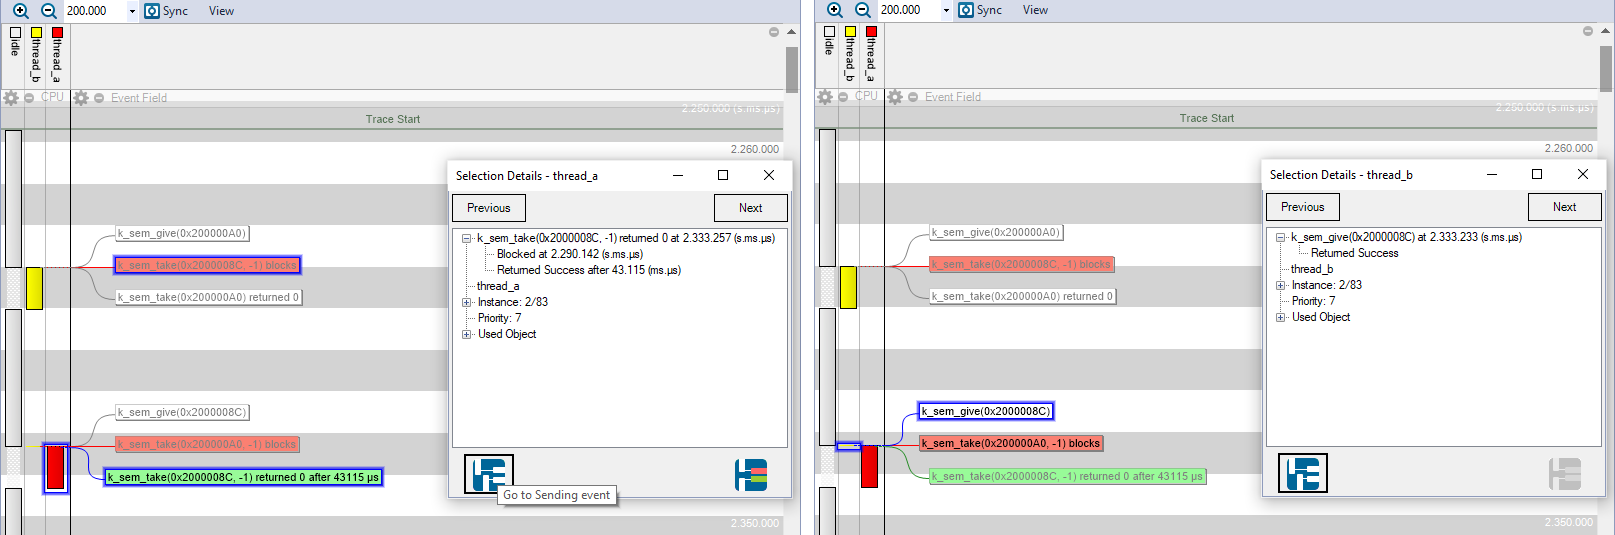
Percepio View is more than just an “event viewer”. It understands RTOS concepts like mutexes, semaphores and message queues, and the meaning of Zephyr system calls. This enables better visualization, making it easier to understand more complex Zephyr traces. For example, blocking on system calls is highlighted by the label color, and by selecting a red label (blocking call), the corresponding green label (return from blocking call) is also highlighted. The lower buttons in “Selection Details“ allow for highlighting related events, as shown below.
Percepio View relies on the TraceRecorder library, available in the Zephyr repository and configurable via the Kconfig system. When enabled, this uses the trace hooks in the Zephyr kernel to trace kernel events, such as context-switches and system calls.
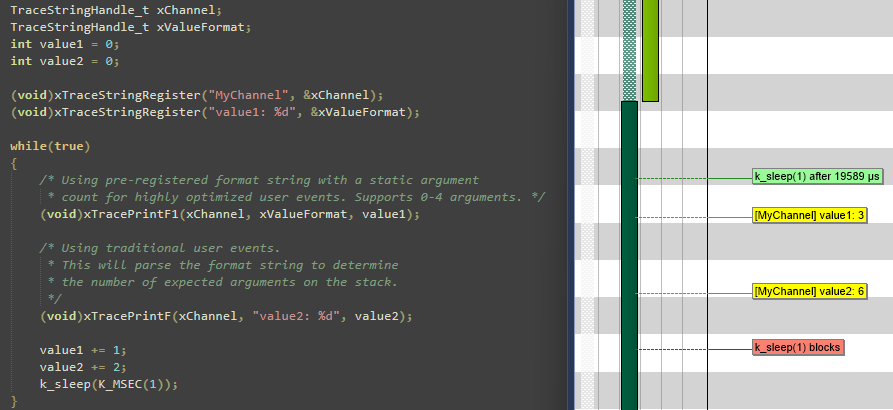
You may also use TraceRecorder to log additional user-defined events (“user events”) by calling the TraceRecorder API. This lets you visualize kernel events and application events together. User event logging is very fast and often a superior alternative to printf logging.
Percepio View provides ”snapshot tracing”, meaning the data is stored in a ring-buffer in target RAM and is saved to the host using the regular GDB debugger connection. This limits the trace length to the size of the trace buffer, but even short snapshot traces can be very useful. For example, if you have sporadic timeout errors from a certain system call, you can put a breakpoint in the return value fault handling. By saving a snapshot at this point, you can inspect the most recent sequence of events that most likely explain the issue.
Reading a snapshot can be done using this GDB command:
dump binary value trace.bin *RecorderDataPtr
If using VS Code, you can run this in the debugger console by entering “-exec <gdb command>”.
You can also configure Percepio View to automate the trace snapshots from the GUI.
- In the main menu, select “Trace” -> “Open Snapshot Tool” and make sure “GDB” is selected as “Snapshot Engine”.
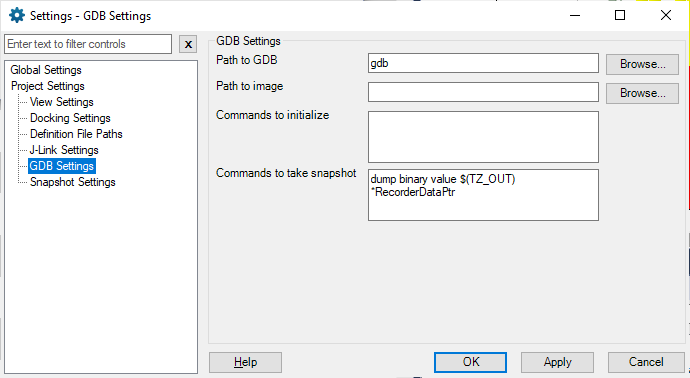
- Next, click on the “Settings” button to configure the GDB settings in Percepio View.
- Path to GDB: Enter the full path to your gdb client executable, for example “arm-zephyr-eabi-gdb” found in your Zephyr SDK folder.
- Path to image: Specify the path to the .elf file in your build folder.
- Command to initialize: should be “target remote localhost:<port>”, where <port> is the TCP port number of your GDB server. If you’re not sure about the port number used, you can typically find it in the GDB server output.
Snapshot tracing works with essentially any board since the hardware requirements are minimal and hardware-specific details like event timestamping are handled by the Zephyr kernel. The TraceRecorder integration in Zephyr has been verified with over 600 boards.
If you need to record longer traces, Percepio also offer solutions for continuous trace streaming in the more advanced products Percepio Profile and Percepio Tracealyzer. They also include many additional views and features.
Percepio View, Tracealyzer and TraceRecorder are described in the Zephyr documentation. To get started, download Percepio View from Percepio’s product page and then check out the getting started guide.
To keep up to date about the project, subscribe to the Zephyr quarterly newsletter or connect with us on @ZephyrIoT, Zephyr Project LinkedIn or the Zephyr Discord Channel to talk with community and TSC members.