This article originally ran on the Percepio website. For more content like this, visit https://percepio.com/blog/.
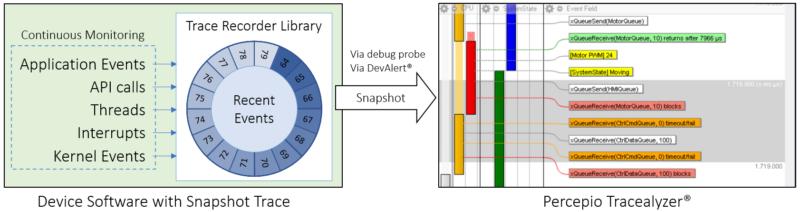
Tracealyzer now has full and official support for Zephyr RTOS. This includes support for snapshot traces, where trace data is stored in a ring buffer on the target system. Percepio has contributed about 18,000 lines of source code to the Zephyr tracing subsystem, to enable the level of tracing that Tracealyzer users require.
The trace recorder is now part of the standard Zephyr download, making it easy to get started with tracing in Zephyr. The upcoming Zephyr 3.0 release will include our new trace recorder library. The new trace recorder library is designed to be easy to port to other software platforms, and to allow tracing of multi-core systems. It supports both snapshot and streaming trace in the same solution, using the same trace format, which makes it easier to maintain and improve.
How it Works
Zephyr contains 250 trace hooks at strategic locations in the kernel code, like the example below. Tracealyzer provides a trace recorder library for Zephyr that uses these trace hooks to record events. No modifications of the Zephyr source code are needed to use Tracealyzer, only a rebuild to enable the hooks.

The trace recorder library also allows you to add your own custom logging in your application code, as described in this guide.
Getting Started with Tracealyzer for Zephyr – Streaming Mode (RTT)
Please notice that Tracealyzer currently only supports streaming over RTT on Zephyr. ITM streaming is in the works and will be released in a future update to Tracealyzer. We also plan to add support for snapshot tracing, where trace data is stored in a local buffer on the target before being sent to the Tracealyzer host. Finally, the Tracealyzer integration is available in Zephyr version 2.6 or later.
Step 1. Get Tracealyzer from https://percepio.com/download/ . In the registration form, make sure to select Zephyr as Target OS. You will receive an email, usually within one minute, with an evaluation license key and the download link. If you do not receive your email, check your spam folder and then contact support@percepio.com.
Step 2. Install Tracealyzer.
Step 3. Set up Zephyr (v2.6 or later).
Step 4. Enable tracing during Zephyr configuration, and choose Percepio Tracealyzer Support as tracing format.

Step 5. Set Recorder Start Mode to Initialize.
Step 6. Start Tracealyzer and open File → Settings → PSF Streaming Settings and select Target Connection: SEGGER RTT.

Make sure you have the following settings (the defaults):
- RTT Control Block Address: auto-detect (= 0)
- Target RTT Up Buffer Index: 1
- Target RTT Down Buffer Index: 1
- Reset Target on Connect: Not checked
- Target Starts Tracing: Not checked
Step 7. Open File → Settings → J-Link Settings, and set the Debugger Interface setting to SWD or JTAG. This setting should match the corresponding setting in your IDE if debugging sessions are done in parallel with Tracealyzer recordings.
We don’t recommend using the “Default (don’t change)” option. The J-Link driver seems to require that you specify JTAG or SWD, otherwise it may ignore the J-Link Speed setting and instead uses a default speed of 200 Khz, which is likely to cause poor throughput.

Step 8. Click Select Device and specify which processor that is used. If your device is not listed, download and install the latest J-Link driver.
Step 9. Start your target system, then click on “Record Streaming Trace” on the welcome screen, or “Start Recording” in the Tracealyzer navigation bar.


You should now see a live trace of your system in Tracealyzer, like this.
Adding User Events
To get more information from your application, such as variable values and debug messages, you can generate User Events that are displayed in Tracealyzer. They appear as yellow labels in the trace view.
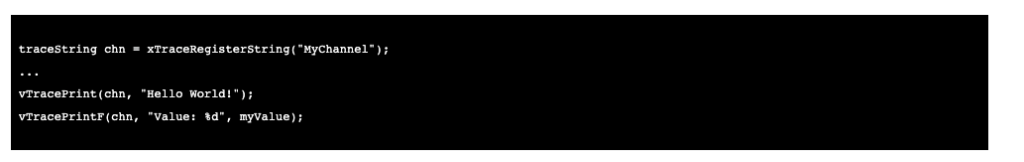
To generate a User Event, you first register a User Event Channel using xTraceRegisterString(). This channel is used to group related events, and sets a name for this channel. You can have multiple channels active in parallel.
Then call vTracePrint() or vTracePrintF() using the handle from xTraceRegisterString() as first parameter. The syntax is similar to the classic printf statement, although not every format specifier is supported.
Example
Tracing Interrupt Handlers
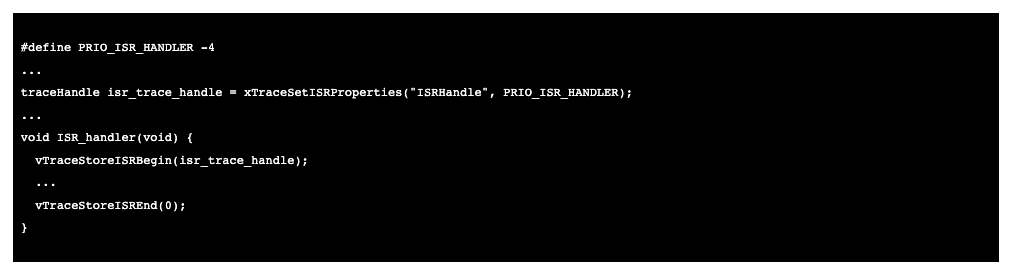
To trace interrupt handlers, first call xTraceSetISRProperties() to specify the interrupt name and priority. This is typically done in your main function, not in the interrupt handler. This returns a handle, that you need to store in a global variable.
Then call vTraceStoreISRBegin() in the beginning of your handler, and vTraceStoreISREnd() in the end.
Example
Troubleshooting
In some cases, the recorder may detect an error caused by incorrect configuration or bad arguments. In such cases, the error handler prvTraceError is called. If you are using an IDE debugger in parallel with Tracealyzer, you may put a breakpoint in prvTraceError to learn more about the problem. The error message or error code is provided as parameter to this function, and your debugger’s call stack view typically shows the context of the error.
In case you have issues related to J-Link streaming, see our specific guide about Troubleshooting J-Link RTT Streaming.
For other issues, check the Troubleshooting section in the User Manual.
If you have any questions, feel free to contact us at support@percepio.com.
Application Notes
RTT Streaming: Console, Logging, and Serial
The Zephyr RTT backends (CONFIG_RTT_CONSOLE, CONFIG_UART_RTT, LOG_BACKEND_RTT) are not compatible with Percepio’s Trace Recorder RTT streaming port (CONFIG_PERCEPIO_RECORDER_TRC_RECORDER_STREAM_PORT_RTT) unless you also enable the internal paged event buffer (CONFIG_PERCEPIO_RECORDER_TRC_STREAM_PORT_USE_INTERNAL_BUFFER). This is because the Zephyr RTT backends enable the CONFIG_SEGGER_RTT_CUSTOM_LOCKING option which configures RTT to use a mutex to manage critical sections, something which will result in infinite trace recursion if the recorder’s internal buffer is disabled.
RTT Streaming: Low Power Mode and Idle
Since RTT uses background memory access to fetch data from the target, it can run into issues and return garbage data if the target is put into low power mode. Although low power mode is disabled by default in Zephyr, for many ARM targets their use of the WFI instruction in cpu_idle.S can cause issues with RTT. If you find that there are significant issues (missed events) with RTT, comment out the WFI instruction and see if that fixes the problem.