Written by Aria Poutanen – BSc Computer Science – University of Victoria
Since the launch of the Zephyr Real-Time Operating System (RTOS) a few years ago, it has been increasingly adopted by developers. In that time as well, its set of API functions have expanded and evolved.
Under the guidance of Dr. Daniel German and Kate Stewart from The Linux Foundation, I worked to create a method to analyze the evolution of API functions within large open source projects, using the Zephyr project as a case study. This blog post will outline our proposed method, as well as go through some of our findings with regard to the evolution of the Zephyr API functions. This project was completed as a final part of my undergraduate Computer Science degree at the University of Victoria.
First off, it is important to mention that the work I did over the last several months would not have been possible without the foundations that Dr. German and the Zephyr team worked on when they created the Cregit git blame tool (https://github.com/cregit). A large part of the methodology we used is based on techniques they pioneered when designing that tool.
The general steps we developed to track the evolution of API functions are as follows:
- Develop a method to identify all functions in a file
- Map this method to the entire repository, effectively keeping functions and filtering everything else out
- Using the repository history stored in a version control system, identify all changes to every function in the repository
- Connect changes together to create the entire history of changes for each function
- Identify specific API functions
- Summarize the information gathered and analyze it to unearth any trends or insights
Identifying functions
Using a Linux utility tool called CTags that identifies different language constructs we were able to create a script that would take in a file of source code and output only function definitions within that source code. We took this a little further and designed the script to output the only specific items we required. Namely, the identifier, type, and declaration of the object in question. The next step was to create a mapped copy of the repository using this script as a filter.
Mapping the repository
A copy of the original Zephyr repository was made using this script using the same process as creating a repoView in the Cregit project. A repoView is simply a mapped copy of an original repository wherein every commit in the new repository has been mapped from a commit in the original repository. Once complete, we had recreated the entire repository (and it’s Git history) using our declaration filtering script. This new repository therefore contained the specific histories of all functions contained in the Zephyr project.
Parsing repository history
The next step in the process was parsing the entire history of the new repository in order to identify relevant changes to functions (namely API functions) that we wished to track. Specifically, when saying “changes” I’m refering to changes important to the integrity of the function. These include changes to the function declaration, if the function was added/deleted/moved/ etc. To do this effectively, we needed to design a definition of state for each change. Git uses a change code to describe the state of a file change, so we created a corresponding change code to reflect the change of a function within that file for each commit. These two codes can then be used to describe exactly what has happened to each function (and the file in which it resides) in each commit. Git change codes represent file changes such as add (A), delete (D), modify (M), copy (C), or rename (R) and function change codes reflect a change in the function signature like add (A), modify (M), delete (N) or no change (N) which is used when a file is copied or renamed but no changes to a given function occurred.
For example, if in a given commit, a function has the codes (M, M), that would indicate that both the file and the function signature were modified. The combination of those two codes, as well as the identifier, file location, signature and collection of details in each commit is a unique identifier to each function change and that data was then inserted into a database. These details include everything needed to describe how a function changed. We document these changes as an ’old’ and ’new’ field that represent the change in the original repository. These ’old’ and ’new’ fields contain different values based on the state of that change. For example, a function change with the codes (M, M) represents a file and function modification and would have an ’old’ signature field containing the previous signature of the function and a ’new’ signature field containing the ’new’ signature of the function. The purpose of storing this information is so that it can be used to link changes to a function together into a complete history of that function.
Connecting the dots
After the entire Git history was parsed and inserted into our database, we were then able to link together collections of individual changes into a full “history” of the lifetime of each function.
Functions in this database can be conceptualized as threads all ”running” in parallel with each other. Each function thread has a start date (when the function was added), a collection of modifications, and potentially an end date if the function was deleted. Each thread was built by linking changes sharing a common identifier based on the change information given by the system state of each change. For example, to determine if change B follows change A in a thread, we can look at the ’new’ signature and filepath of change A and see if they match the ’old’ signature and filepath of change B. Once a collection of changes was identified, they were all assigned the same unique id number. These id numbers uniquely identify functions – very useful especially given that there were a good number of functions with common names in different files.
Looking at the results
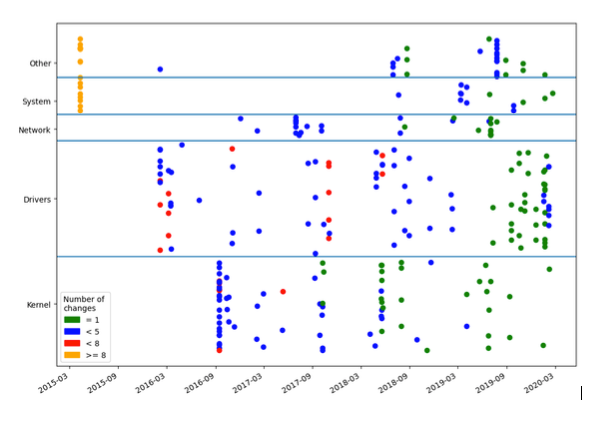
Once we had created the database and connected together the histories of all functions therein, we were able to use this data to create some interesting visuals. These charts were all created by looking at only the Zephyr kernel API functions – a subset of the full set of function information that was available to us.
Note – the following charts show raw, unprocessed changes from each function history. This means that significant changes to the integrity of a function (ie, change in signature, add/delete of parameter, etc) are mixed in with changes that indicate when a function was moved to a different file, added/deleted, etc. This means that these visualizations are overestimating the true number of changes to the declarations of each function.
The first chart shows function creation date plotted with number of overall changes, and grouped by module. We can see that older functions have more changes than the recently added functions, which makes sense as functions that have been around for longer have a higher probability of being worked on. However, we could also take this observation as an indication that a significant amount of more recently introduced API functions are quite stable, seeing how they have been changed a minimal number of times. This figure also indicates when some relationships between function development and module development – many functions are changed at the same time within modules. For example, the line of yellow dots around April 2015 shows when some of the earliest API functions were introduced, that they were a part of the ’System’ (and other) modules, and that they have been more heavily modified since the start of the project than other functions.
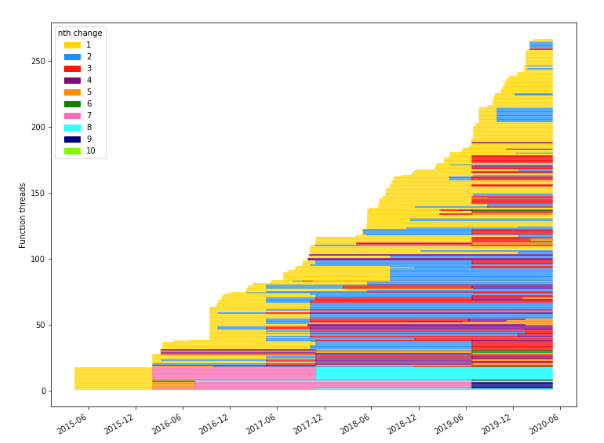
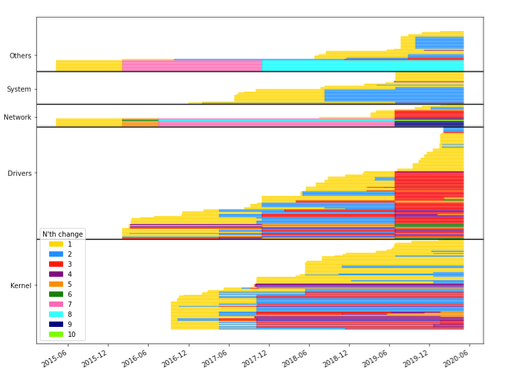
This next chart shows the time spent between changes for all API functions. These plots show units of time in different colours based on how long each function has a given number of changes. Each horizontal line represents a specific function, ordered by add date. For example, all of the yellow sections on each chart represent the time when each associated function had been added before any modifications had been made.
We can see that modules tend to have large common areas of development.
Case study: k_thread_create
We can examine a singular function to see its’ evolution in a greater context. This chart singles out k_thread_create out of the larger context, and the following table shows a breakdown of it’s evolution. Changes in the function definition have been highlighted in order to easily see the changes.
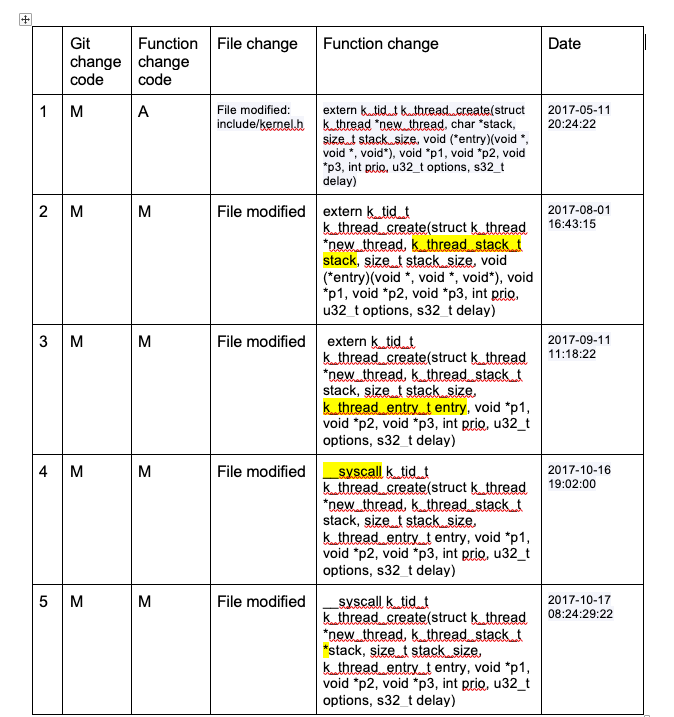
The changes to k_thread_create are almost entirely to its function signature. Once added to include/kernel.h, the function is never moved from that file. These are the kinds of changes that can affect developers downline, but we can also see that they happened relatively close together and the function has remained stable ever since.
While not perfect, this method does provide some interesting insights into the development of the Zephyr project and the evolution of it’s API functions. There is ample evidence to support the idea that the majority of changes applied to API functions are related to specific development in the module that they belong to, that this development happens to groups of API functions at the same time, and that there are long stretches of time between these changes (in many cases). A heuristic of stability is long periods of no change, so we would argue that there are many times where the majority of API functions have been stable. Of course, there will always be outliers, especially functions that are not explicitly tied to the development of a large module, but this seems to be the minority.
The visualizations we created do a good job of showing the development of both individual functions and the entire set of API functions as a whole over the history of the Zephyr project. Using these, one can get a general idea of both stability and evolution of the APIs of this project.