
The Zephyr Project has announced the general availability of Zephyr 4.3 and it is my great pleasure to walk you through some of the highlights of this release, which once again saw contributions from nearly 800 individuals.
As always, I have put together a demo video that goes together with this article and dives deeper into all the great new features and improvements of this release. I highly encouraged you to watch it especially since, this time around, I tried to use the same application and use case throughout the whole video so that it’s easier to follow. So, join me as we build a Zephyr-powered electric vehicle charging station using Zephyr 4.3!
As you read through the article, clicking on the ▶️ symbol will take you to the section of the video that shows the feature in action.
Also, be sure to mark your calendars for our next Zephyr Tech Talk on Wednesday, November 26, as I will be joined by Chris Friedt and Johan Hedberg, our two release managers for Zephyr 4.3, to discuss their highlights and answer all your questions. Register on YouTube or LinkedIn to get a reminder the day of (or catch up the recording anytime!).
The merge window for Zephyr 4.4 is already open and, as the project has recently adopted a new bi-yearly release cadence, the next release will be happening in April, 2026. Also, don’t miss the train if you want to claim pull request #100,000, we are going to reach that milestone imminently!
▶️ USB Device “Next” stack is now the default
The multi-year effort to modernize Zephyr’s USB device support finally lands, and the re-architected USB Device “Next” stack now ships as the default implementation. The legacy USB device stack is now deprecated and scheduled for removal in version 4.5.0.
In case you are not familiar with it, the “next” stack provides a cleaner separation between the USB controller drivers and the higher level device stack. USB devices are now much easier to implement: class instances can be registered/re-configured on the fly, multiple device controllers can be used simultaneously, etc. It is also worth noting that both full- and high-speed device controllers are supported. The stack ships with implementations of many of the well-established USB Device classes such as: USB Audio 2, CDC ACM/ECM, Mass Storage, HID, Bluetooth HCI, UVC, MIDI, …
▶️ CPU Load and Dynamic Frequency Scaling
Balancing processing performance against power consumption can be a challenge for embedded applications that are battery powered and yet, from time to time, need peak performance. For example, you may want to temporarily boost CPU speed when handling short bursts of sensor data or network activity to keep latency low, while still saving as much power as possible when idle.
Zephyr 4.3 introduces a dynamic frequency scaling subsystem that makes it possible to adjust CPU frequency at runtime. This dynamic scaling can be done according to specific policies, starting with what’s maybe the most natural one: adapting CPU speed based on observed system load.
performance-states {
	pstate_0: pstate_0 {
		compatible = "zephyr,native-sim-pstate";
		load-threshold = <50>;
		pstate-id = <0>;
	};
	pstate_1: pstate_1 {
		compatible = "zephyr,native-sim-pstate";
		load-threshold = <20>;
		pstate-id = <1>;
	};
	pstate_2: pstate_2 {
		compatible = "zephyr,native-sim-pstate";
		load-threshold = <0>;
		pstate-id = <2>;
	};
};
A new cpu_load_metric_get() function has been introduced to easily obtain CPU usage information and is used under the hood the “on-demand” policy.
▶️ Instrumentation Subsystem
Zephyr has pretty much always shipped with the ability to trace and profile applications. The way it typically works is that this relies on existing trace points already placed in the kernel code (some subsystems, such as networking, also provide “built-in” tracing capabilities).
The new instrumentation subsystem takes a different approach by leveraging compiler-managed function instrumentation. Instead of requiring developers to manually add “hooks” throughout their application, the subsystem uses compile-time instrumentation to automatically insert hooks at the entry and exit of every function. Thanks to these hooks, it is able to collect usage statistics (profiling) at runtime to help identify performance bottlenecks, as well as to reconstruct call graphs (tracing), allowing developers to better understand how a given piece of code works.
The instrumentation subsystem can be enabled using CONFIG_INSTRUMENTATION option (and there are of course many sub-options available to tweak its behavior) and a companion CLI tool, zaru.py, simplifies the extraction of the collected data and metrics that can then be further analyzed using third-party tools such as Perfetto.
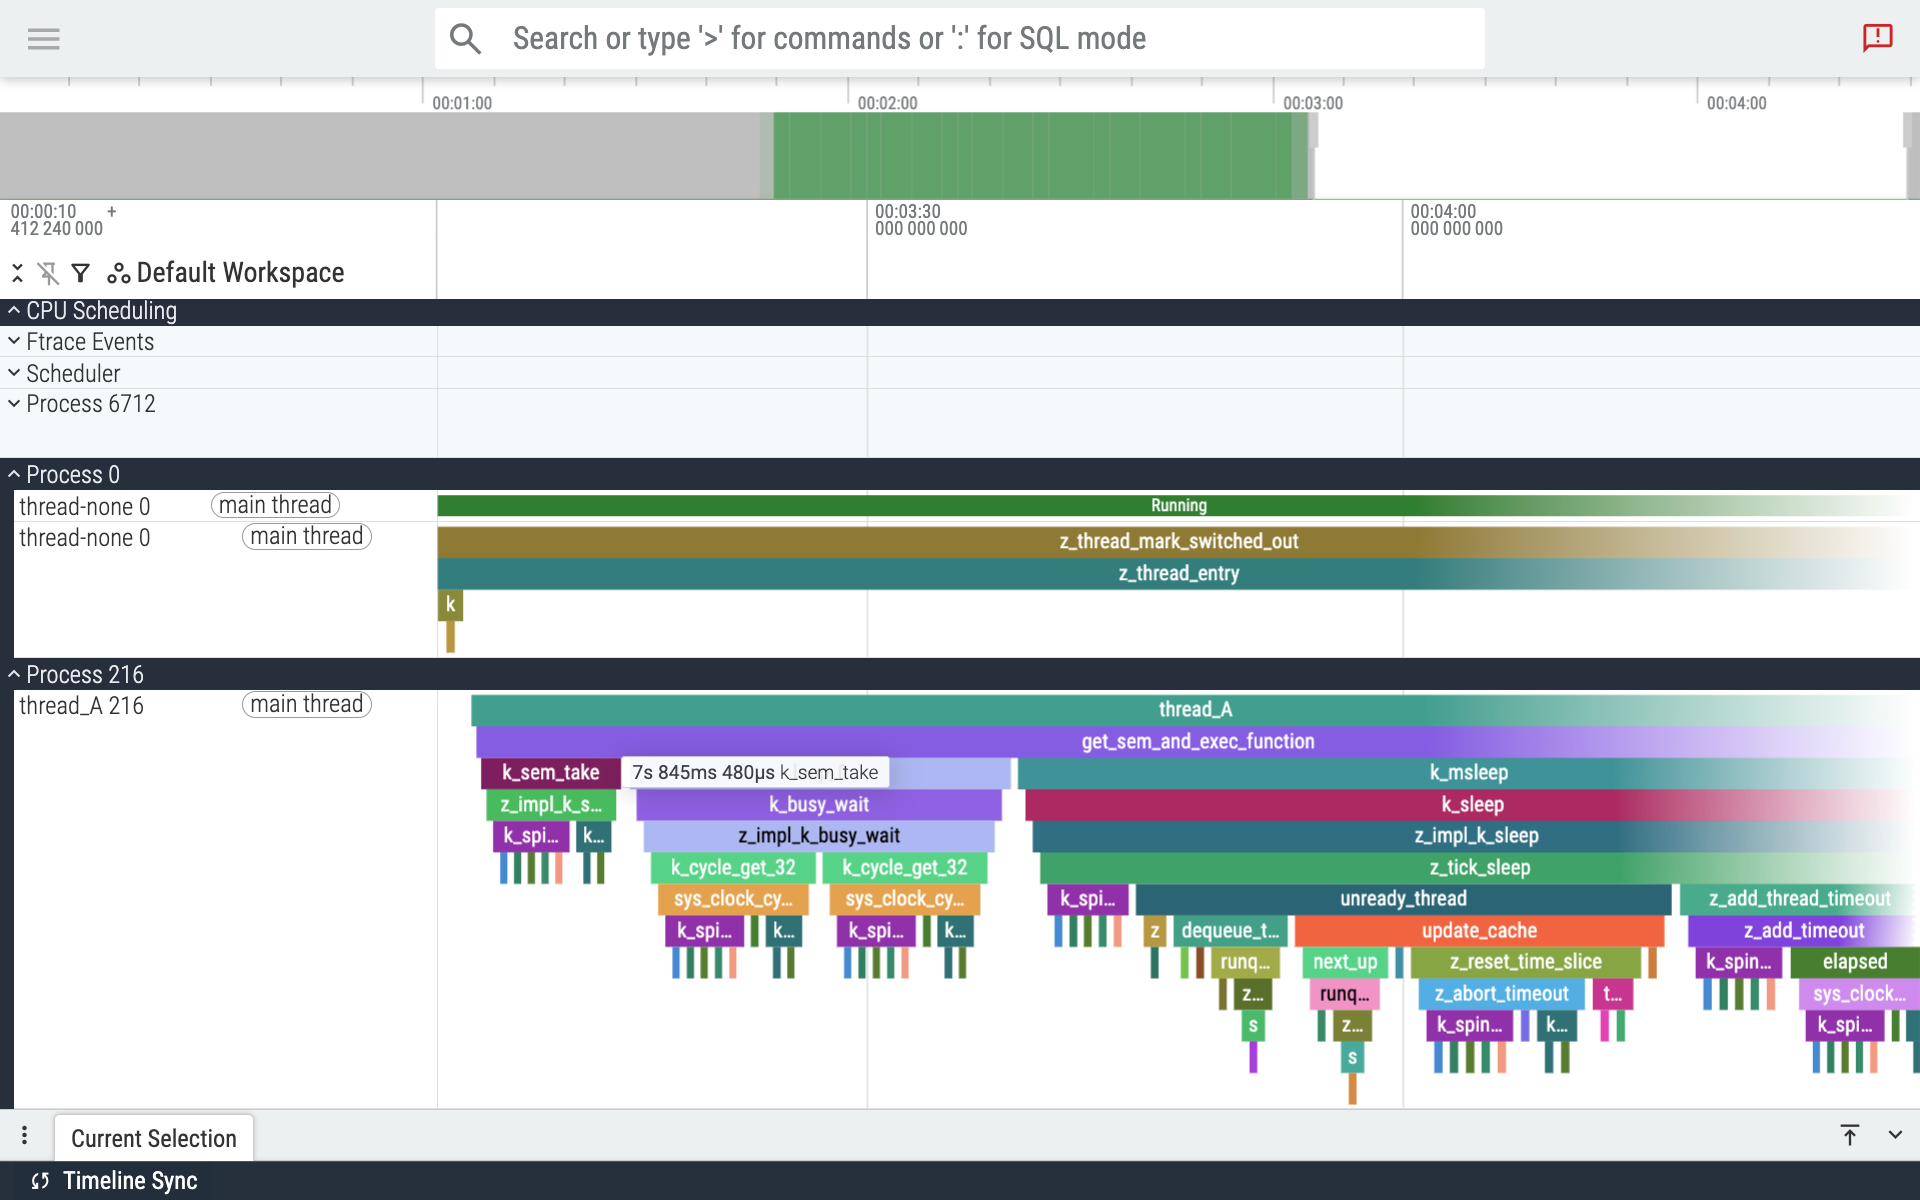
Visualizing call-graphs obtained using the Zephyr instrumentation subsystem in Perfetto
▶️ OCPP 1.6 Library for EV Charging
Open Charge Point Protocol (OCPP) is a standard for the communication between electric vehicle (EV) charging stations and central management systems. Zephyr 4.3 adds support for OCPP 1.6, making it possible to build standards-compliant EV charging solutions.
The new library implements all the key features of OCPP 1.6 including profiles for remote charging, reservation, etc.
What I find particularly exciting about this new feature is how things just worked when I connected my demo setup to an open-source server, CitrineOS (shout out to LF Energy for providing several really impressive open source stacks for all things… well… energy!). Open source and open standards for the win!
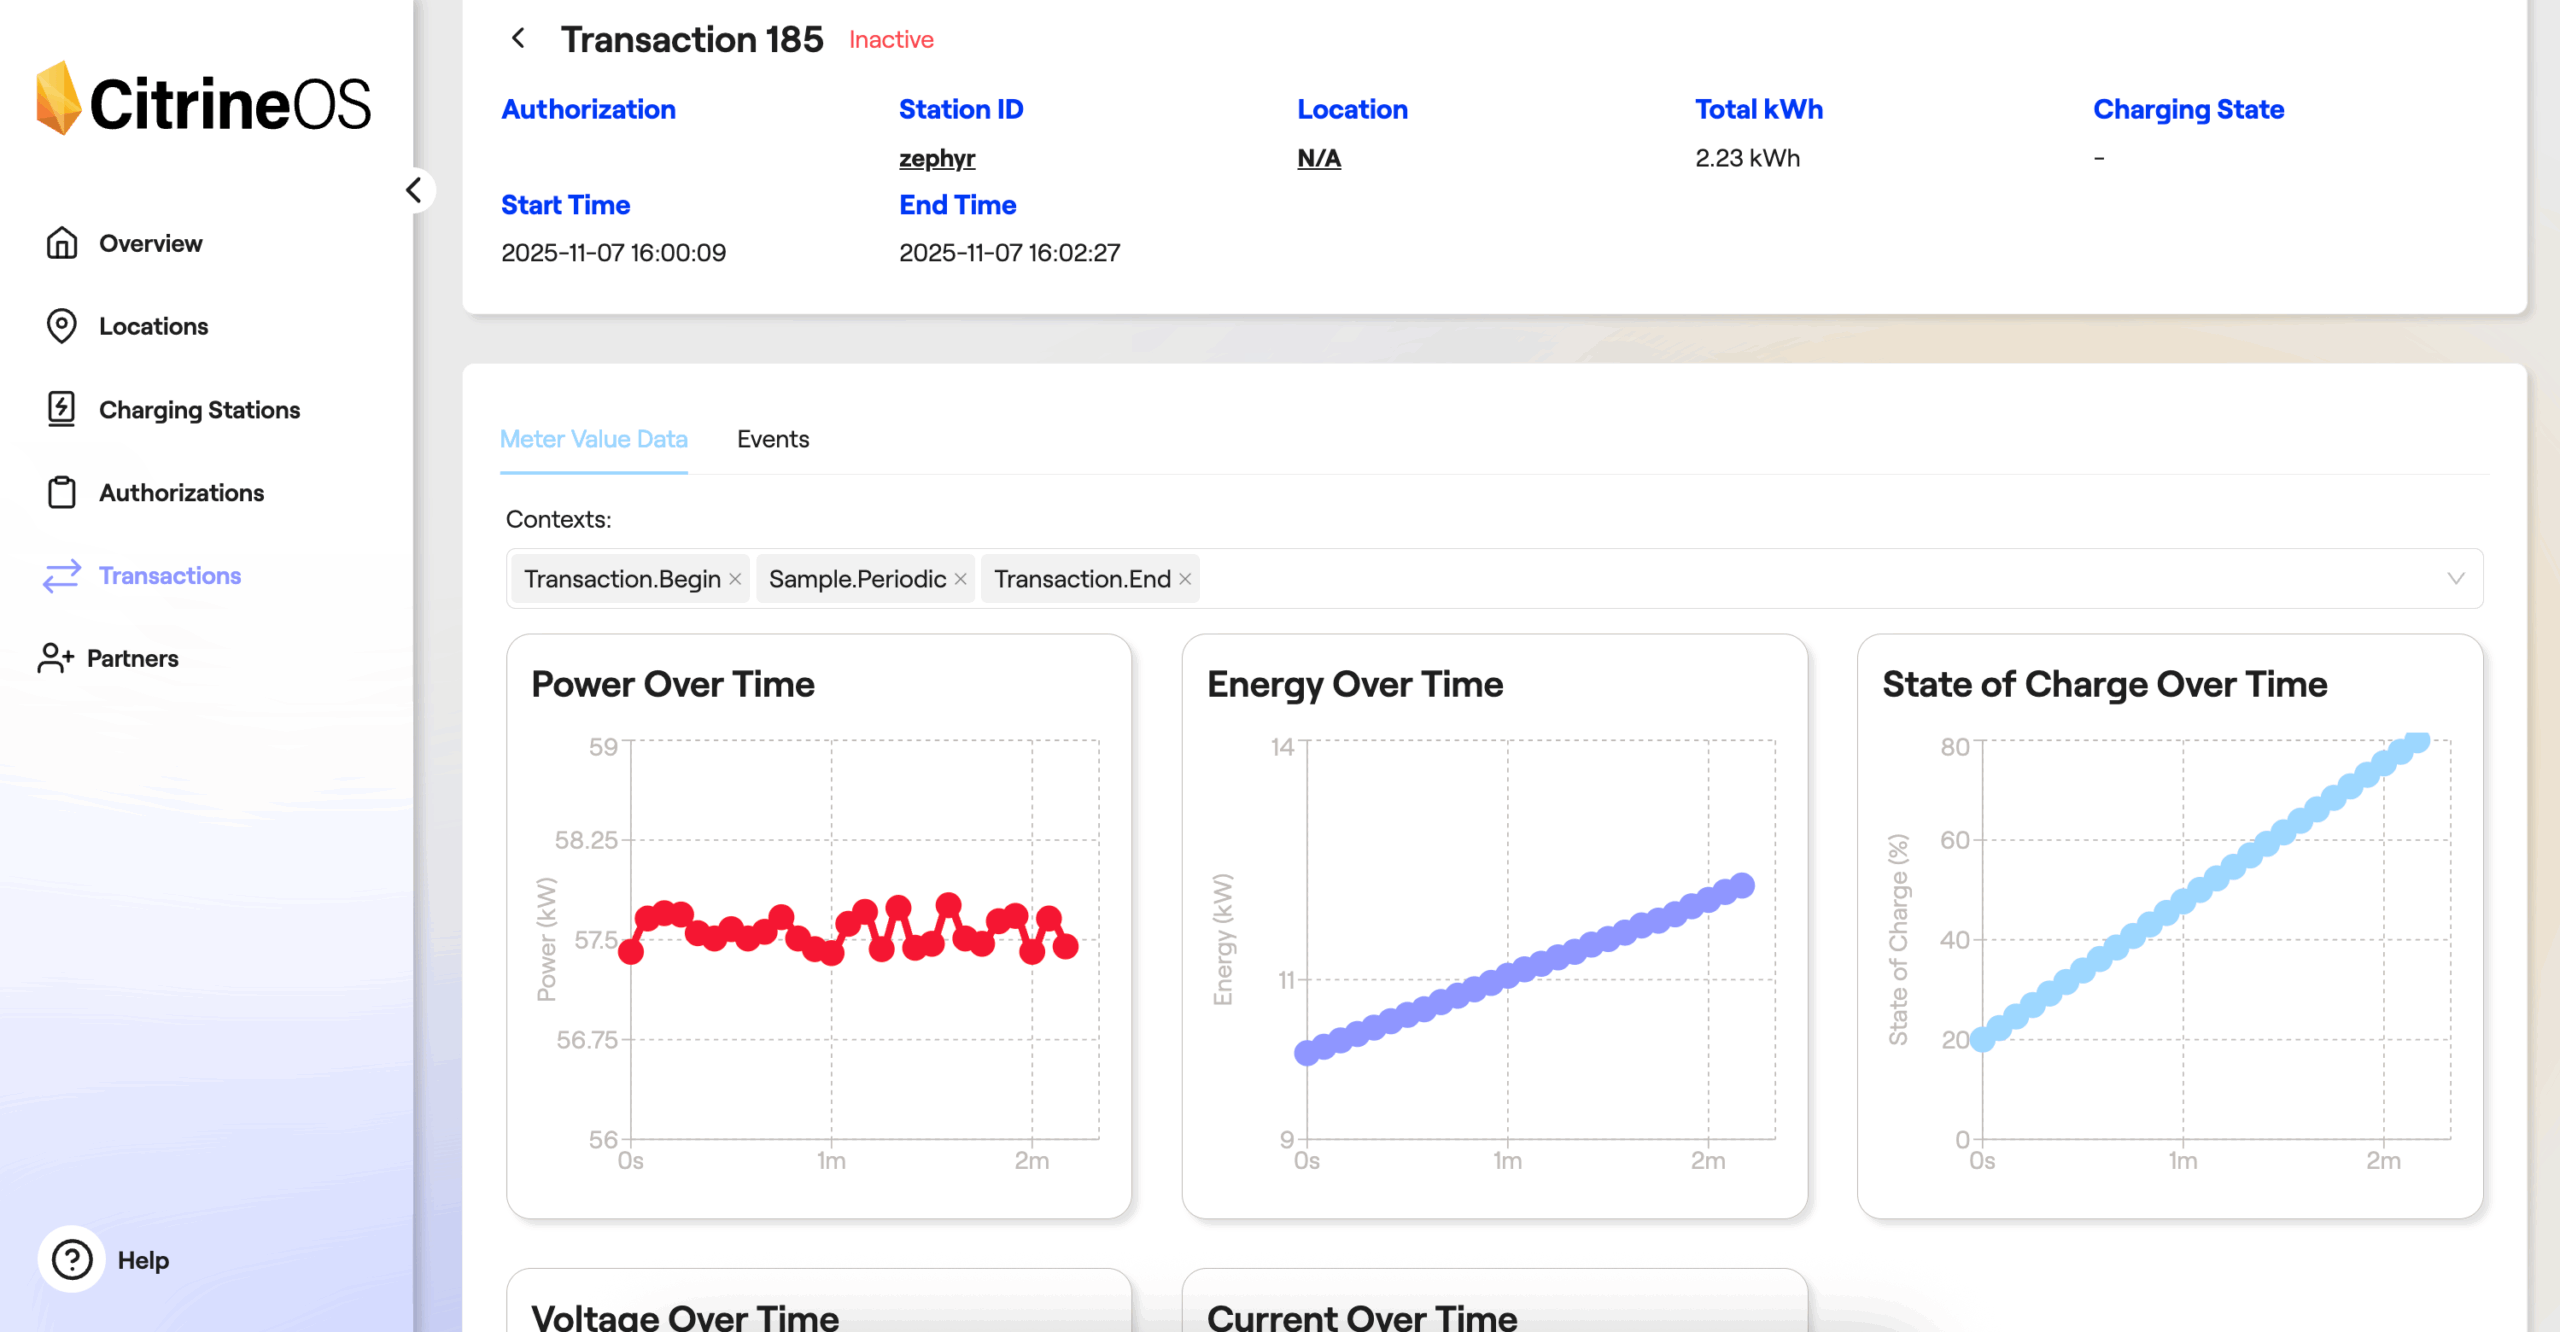
A Zephyr-powered EV Charging Station talking to a CitrineOS backend server
▶️ Twister Display Harness
Automated testing of graphical displays and user interfaces has historically been challenging as evaluating whether things “look” correct would typically require human intervention. Zephyr 4.3 introduces a way to integrate automated display testing in Twister thanks to a new “display capture” harness.
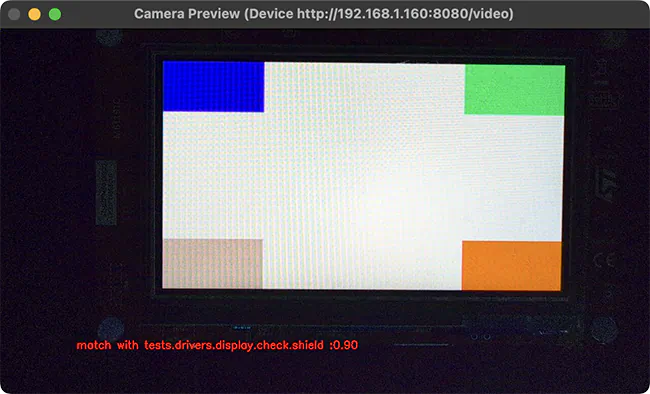
This new harness verifies display output by capturing live video of the device’s screen using a standard USB camera (high definition preferred!), then automatically comparing it to a known-good visual “fingerprint”. It is built on top of the very popular OpenCV computer vision framework and validation against reference images is done using a combination of algorithms that capture color histogram, contrast information, perceptual hash, etc.
The relative weight given to each fingerprinting method is configurable, making it possible to test a variety of things, from low-level correctness of the display driver itself (e.g. looking for color channel inversion), to high-level validation that the actual graphical user interface has all the right widgets in the right place.
Developer Experience Improvements
▶️ dtdoctor: A Devicetree diagnostics tool
Let the one who has never wrestled with obscure Devicetree errors cast the first stone at me 🙂 Due to how Zephyr is using Devicetree and Kconfig, many of the mistakes that developers may make when configuring their system are somewhat hard to decipher as failures happen during macro pre-processing or at the linker stage, and involve non-immediately readable machine identifiers. Enter DT Doctor 🧑🏼⚕️!
DT Doctor is a new tool that inspects the compilation logs and identifies what the root cause of Devicetree-related errors might be. It can be enabled very simply, like any other static code analysis tool in Zephyr: west build <app> -- -DZEPHYR_SCA_VARIANT=dtdoctor.
There are two classes of errors that it helps track down:
- A Devicetree node is properly enabled but no device driver seems available to “handle” it, making some parts of the code fail at the linking stage (the dreaded “
undefined reference to `__device_dts_ord_37`” error message!). The tool will suggest the Kconfig option(s) that might need to be enabled for the driver to properly kick in.
...
/home/kartben/z/samples/subsys/display/cfb/src/main.c:81: undefined reference to `__device_dts_ord_37'
collect2: error: ld returned 1 exit status
+-----------------------------------------------------------------------------------------+
| DT Doctor                                                                               |
+=========================================================================================+
| 'ili9341: /mipi_dbi/ili9341@0' is enabled but no driver appears to be available for it. |
|                                                                                         |
| Try enabling these Kconfig options:                                                     |
|                                                                                         |
|  - CONFIG_DISPLAY=y                                                                     |
+-----------------------------------------------------------------------------------------+
- A Devicetree node should be enabled for a given functionality to properly work. For example, you have an “LED” node that appears to be properly enabled in your Devicetree, and yet the “blinky” code sample doesn’t seem to work… could it be that the GPIO controller associated to the LED GPIO is perhaps disabled?
/home/kartben/z/samples/basic/blinky/src/main.c:21:40: error: '__device_dts_ord_12' undeclared here (not in a function); did you mean '__device_dts_ord_13'?
   21 | static const struct gpio_dt_spec led = GPIO_DT_SPEC_GET(LED0_NODE, gpios);
      |                                        ^~~~~~~~~~~~~~~~
      |                                        __device_dts_ord_13
+-----------------------------------------------------------------------------------------------------------+
| DT Doctor                                                                                                 |
+===========================================================================================================+
| 'porta: /soc/pinctrl@41008000/gpio@41008000' is disabled in /home/kartben/z/dts/arm/atmel/samd5x.dtsi:273 |
| The following nodes depend on it:                                                                         |
|  - /leds                                                                                                  |
|  - /usb_power_5v_en                                                                                       |
|  - /leds/led_0                                                                                            |
|                                                                                                           |
| Try enabling the node by setting its 'status' property to 'okay'.                                         |
+-----------------------------------------------------------------------------------------------------------+
▶️ traceconfig: Who set this Kconfig option?
west build -t traceconfig is a new build target that allows to obtain a report aimed at understanding “where” the configuration of an application comes from, including those options that developers may not have directly set and just have default values, or options that are pulled in through transitive dependencies.
The traceconfig report—a kconfig-trace.md Markdown file in your build folder—shows, for each Kconfig symbol, what value it has and whether it is a default, something that was explicitly assigned, or selected/implied by another symbol and, maybe more importantly, it tells the exact file and line number responsible for that setting.
Here is an example of the report you can obtain:
| Type | Name | Value | Source | Location |
|---|---|---|---|---|
| int | CONFIG_APPLICATION_INIT_PRIORITY |
90 | default | kernel/Kconfig.device:82 |
| int | CONFIG_ARCH_DEVICE_STATE_ALIGN |
4 | default | arch/Kconfig:551 |
| int | CONFIG_ARCH_IRQ_VECTOR_TABLE_ALIGN |
4 | default | arch/Kconfig:541 |
| bool | CONFIG_ARCH_LOG_LEVEL_DEFAULT |
y | default | subsys/logging/Kconfig.template.log_config:5 |
| int | CONFIG_ARCH_SW_ISR_TABLE_ALIGN |
4 | default | arch/Kconfig:587 |
| bool | CONFIG_ASSERT_VERBOSE |
y | default | subsys/debug/Kconfig:230 |
| … | ... |
… | … | … |
| string | CONFIG_COVERAGE_DUMP_PATH_EXCLUDE |
“” | default | subsys/testsuite/Kconfig.coverage:96 |
| int | CONFIG_CPU_FREQ_INTERVAL_MS |
500 | assigned | samples/subsys/cpu_freq/on_demand/prj.conf:12 |
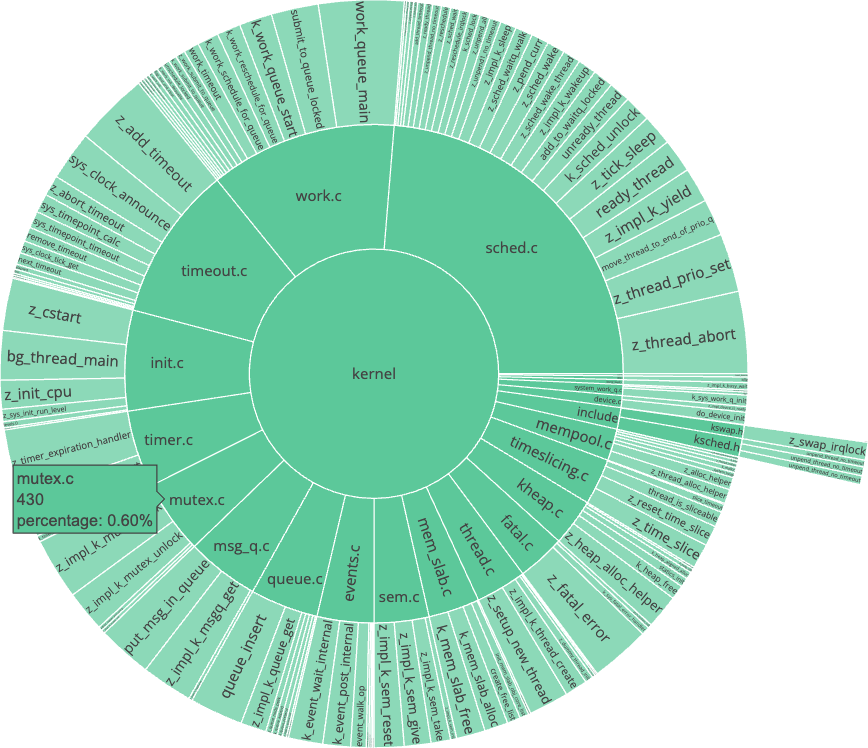
▶️ Interactive footprint charts
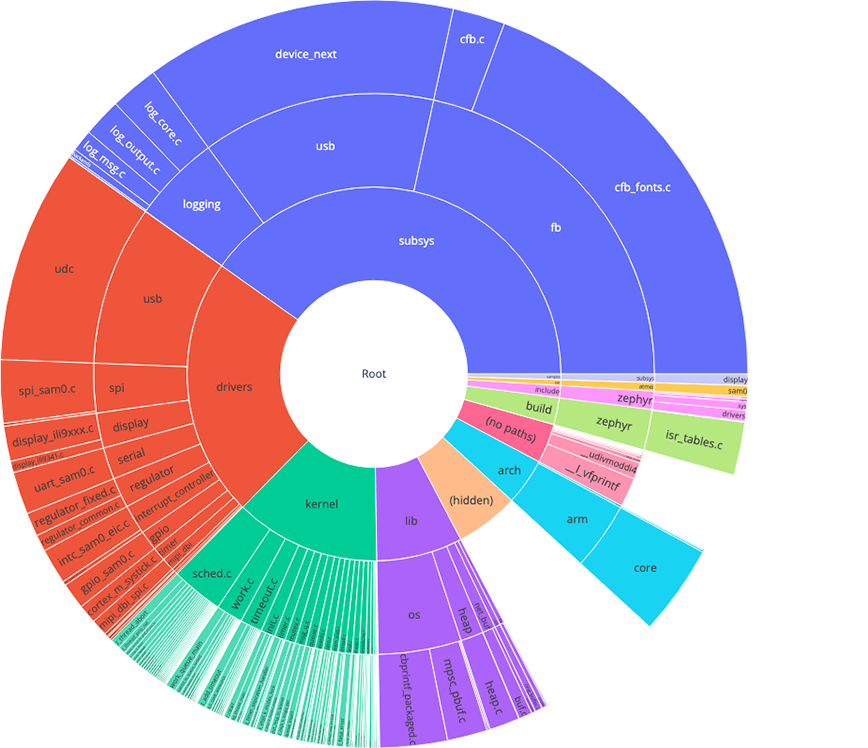
Taking the existing text-based ram_report and rom_report build targets to the next level, this release introduces interactive footprint charts. They provide a visual and interactive way to explore an application’s RAM and ROM usage, making it far easier to identify memory hogs and optimize an application’s footprint. These interactive RAM/ROM charts can be generated by invoking the west build -t ram_plot (respectively rom_plot) build targets.
-

- Interactive ROM usage report
-
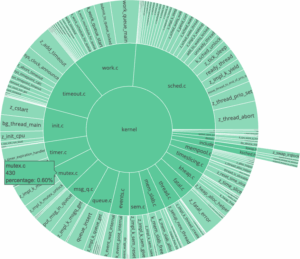
- Interactive ROM usage report (focus on kernel/)
And more!
You will probably want to have a closer look at the over 100 new boards and nearly 40 new shields that were added in this release for many silicon vendors (and passionate individuals as well!) have been very busy bringing up new platforms to Zephyr.
Catch up on the full release notes and do not forget the migration guide that documents the steps you need to take to update your Zephyr 4.2-based code.